FireLens
Building-level wildfire damage assessment: Gemini compares pre- and post-fire satellite crops of every building, and the results go on a map with a chat assistant.
- Role
- Team of 6, CS 4485 capstone, UT Dallas. My part: dashboard UI, chatbot integration, live evaluation endpoint, deploys.
- Stack
Problem
After a wildfire, responders and insurers need to know which buildings are gone, which are damaged and which are fine, and much of that is still people comparing aerial photos one building at a time. We tested how far a general-purpose vision-language model gets on that comparison with no task-specific training.
What I built
A pipeline that crops every building footprint from the xBD Santa Rosa wildfire tiles before and after the fire, and asks Gemini for a damage level, confidence and short reason as strict JSON.
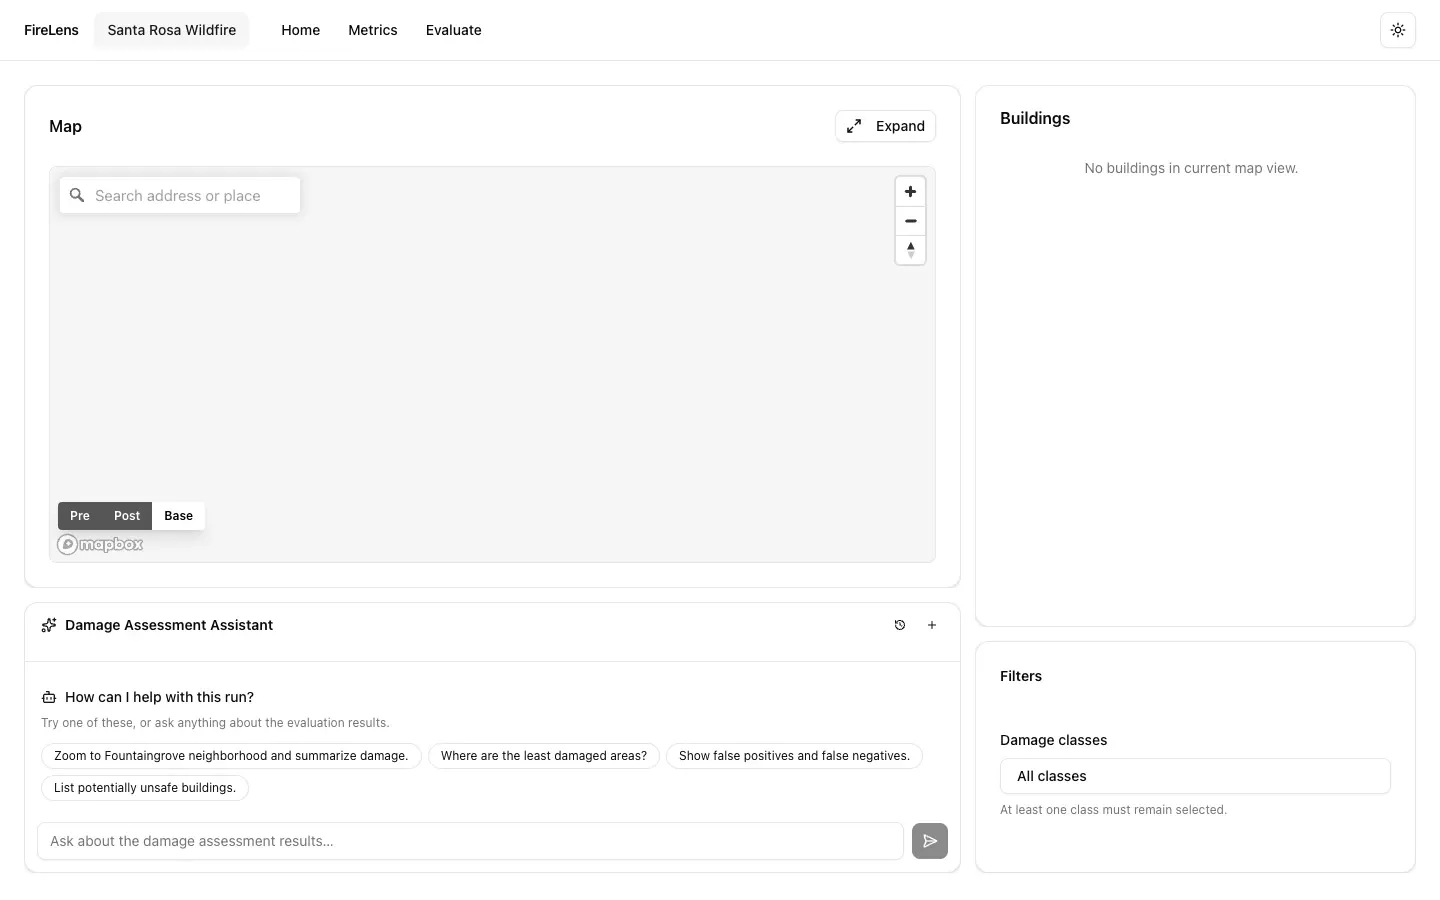
A Next.js and Mapbox dashboard with pre/post imagery layers, footprints colored by predicted damage, a building inspector with the model’s label next to the FEMA label, metrics, and a chat assistant grounded in the results and the current map view. A FastAPI backend serves chat and live evaluation; data lives in Cloudflare R2.
My part (top committer): I built the first dashboard UI (map panel, building list, details drawer, filters), set up the Vercel and Render deployments, added building flagging, summaries and street addresses, integrated the chatbot into the backend and dashboard, added the live /v1/evaluate endpoint and rate-limit handling, and fixed the map and pre/post layer rendering.
Results
- Zero-shot on 4,214 labeled buildings: 81.6% accuracy. No-damage F1 is 0.89.
- When the model calls a building destroyed it is right 74% of the time, but it finds only 47% of destroyed buildings. The minor and major damage classes (28 buildings) are too rare to say anything about.
- The live demo’s data backend is currently down, so the map on the live site may be empty. The screenshot is from the repo.